Gracie & Friends
Teaching preschoolers about data
In today’s world, almost everything is driven by data. What could the future hold if the newest generation grew up understanding it?
At GBH Kids, I was the lead designer on a multi-year research project investigating how to teach preschoolers about data. Our goal was to develop an interactive experience that taught 4 year olds how to collect data, build graphs, and analyze them.

An app for classrooms
The end result was an app designed for use in preschool classrooms by teachers that could supplement in-person lesson plans and activities about data. The class could read their favorite stories, go outside and find objects in nature, or get up and move their bodies and then use the app to turn these experiences into data. Features in the app were designed with connection in mind, and help spark curiosity, conversation, and creativity in these young learners.
A homemade icon library
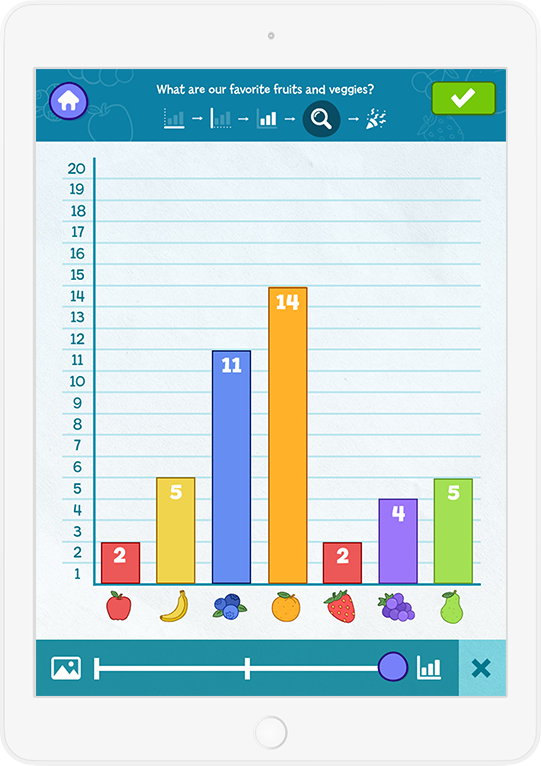
In addition to leading the UX / UI design, I also was the sole illustrator for this app. One of my favorite parts of this project was illustrating over 50 adorable icons that kids could use on the x-axis of their graphs. Below are some of my favorites!


Flexibility and customization for teachers
A digital product shouldn’t limit the in-person classroom experience, and that’s why we designed this app to include a variety of options along the way. Teachers can give graphs unique names, draft their own research questions, build their own activities from scratch, and even take photos to add as categories on the x-axis.
A powerful tool to spark conversation
After teachers and kids build a graph together, they can analyze the graph in a variety of ways. The app includes an annotation tool that allows teachers to draw notes on the graph, a sorting tool to re-arrange the data in the graph, and built-in prompts to help encourage dialogue. One of teachers’ favorite features is a slider that hides the pictures in the bars to demonstrate what a bar graph looks like.